


Do you want to measure what's going in and what's going out your router? I always did, and after some searching I found a tool to do this and plot it in a graph
I found MRTG which is the predecessor of RRDtool, used by the largest internet exchange in the world: Amsterdam Internet Exchange
Now, RRDtool is nice, but it will be too advanced for what we want to do, so in this how-to we'll stick to MRTG which does the job just as well
The good thing about this monitor is that it only polls once every 5 minutes, so it uses hardly any CPU and will allow the harddrive to spin down now and then.
Before you begin
You need a proper IPKG setup (e.g. from wengi's how-to).
Also you need to activate the SNMP server in the webadmin interface:
Set it up like in this screenshot
Furthermore, you need some way to access the generated graphs, this can be done via a samba share or a webserver.
Installing
It's as easy as executing:
Creating config filesipkg install mrtg
The IPKG package doesn't come with configuration files since they're different for every system!
Before you can generate a config file you NEED to make sure the SNMP server is up and running.
Adjust the workdir to your needs, this workdir should be accessible via samba or a webserver. Also don't forget to create the folder before you assign it.
now wait a few seconds while the configuration is being made./opt/bin/cfgmaker --global 'WorkDir: /tmp/mnt/share/mrtg' --global 'RunAsDaemon: Yes' --global 'Options[_]: bits,growright' --output /opt/etc/mrtg.cfg public@localhost
Making a startupscript
and paste the code:vi /opt/etc/init.d/S99mrtg
save it and make it executable:#!/bin/sh
if [ -n "`pidof mrtg`" ]; then
killall mrtg 2>/dev/null
fi
/opt/bin/mrtg /opt/etc/mrtg.cfg
chmod +x /opt/etc/init.d/S99mrtg
Starting and monitoring
Just execute
and it should start monitoring./opt/etc/init.d/S99mrtg
Now just browse to the folder you put as workdir (either via samba or webserver).
You'll see a few html pages called "localhost_x.html" (where x is a number).
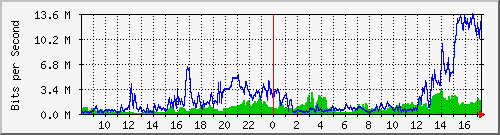
Just open up one of those files and the browser should open a page about a single network interface containing daily, weekly, monthly and yearly graphs.
Usually "eth1" is the WAN port (where the internet goes in) so there you can see all the results for internet usage.
Note that the speeds are displayed in bits per second meaning you have to devide the numbers by 8 to get the bytes per second.
the end
I hope you'll have fun monitoring.
some extra: http://wl500g.info/showpost.php?p=205121&postcount=18
kolaCZek made a nice post about some other scripts to monitor cpu load, memory usage and ping
Just put the mrtg settings in the mrtg.cfg config file and the bash scripts in /opt/etc/mrtg (like described in the target information)
don't forget to chmod +x /some/file the bash scripts to make them executable


 Reply With Quote